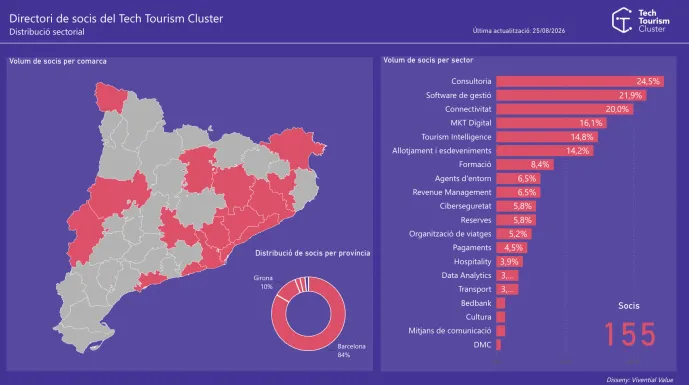
Understanding the size and diversity of the companies that make up the Tech Tourism Cluster is key to understanding the richness of our ecosystem. That is why we have added a new interactive viewer to our website, allowing users to easily and visually explore how our members are distributed.
The tool, developed by our colleagues at Vivential Value, allows users to analyse the cluster’s ecosystem from different perspectives and gain a clearer view of its geographical and sectoral distribution.
The viewer provides information on:
📍 Number of members by county, showing where the companies that make up the Cluster are concentrated.
🌏 Distribution of members by province, providing an overview of the ecosystem’s geographical presence.
🏨 Number of members by sector, highlighting the diversity of activities and professional fields represented within the Cluster.
This new feature allows us to turn data about our ecosystem into visual, accessible and useful information, helping to provide a better understanding of the traveltech sector in Catalonia and highlighting the diversity of the companies that are part of it.
At the same time, the viewer offers a new way to discover the Tech Tourism Cluster, understand its geographical reach and explore the variety of sectors represented by our members.
🫱🏻🫲🏽 We would also like to thank our colleagues at Vivential Value, who have worked on the development of the viewer and on transforming our ecosystem data into an agile and visual tool.
🔎 We invite you to explore the new viewer in the “Members” section of our website and discover more about our ecosystem!
Author

Project Manager
Recent posts

08 October 2026

08 October 2026

07 October 2026

07 October 2026
Tags
-
News
Subscribe
Subscribe here and stay tunned on what's next